Detecting change points in one-dimensional time series data using CoDIP (1)
Go to Korean ver. of this article (https://inforience.net/2018/03/12/changepoints1d-1kor/)
Consider a system that performs the following tasks:
- Automatically detect when your concentration level begins to drop suddenly
- Automatically detect when driving status of a vehicle suddenly changes
- Automatically detect when operating status of an equipment suddenly changes
- Automatically detect strange sounds or movements at night time
- Automatically detect when the weather suddenly gets hot.
- Automatically detect when stock prices plunge suddenly
- Automatically detect when grades begin to fall
If you can keep an eye on your data personally, these tasks will not be difficult. The only thing you have do is to find the moments. However, no one is able to look at the data 24 hours a day. These tasks should be left to the computer. In other words, we have to tell the computer: “I will hand over the data to you continuously, then let me know if you find any critical moment of changes.”
The explosion of IoT devices has made it possible for anyone to collect sensor data. We can also easily obtain various data from the web or the cloud. In the future, even if you are not a data scientist or engineer, you may want to find personally important moments from your data. Therefore, it would be nice if you have the capability of intelligently detecting important changes and performing related tasks accordingly.
Much research has been done on Outlier Detection, Change Point Detection, and Anomaly Detection. The researches have tried to develop efficient algorithms that can self-detect important change points in the data even when there is no prior knowledge of the data.
Is it really difficult to detect critical change points automatically?
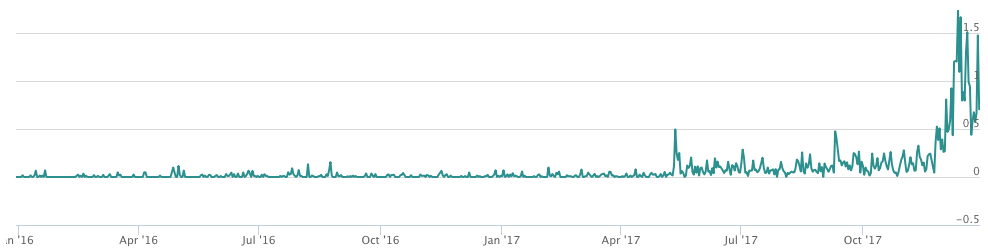
Figure 1. Trend of ‘virtual currency’ mentioned in Korean online news for the past two years.
Patterns can be detected based on simple rules. For example, if the temperature rises above 20 degrees Celsius, it can be detected. If the stock price rises 10 point, it can be detected. These rules can be expressed by simple programming code. However, there may be numerous change points in the data. It is impossible to predict and define the rules for all possible changes in advance. It is not easy to distinguish critical and non-critical changes in advance. To make matters worse, the data may contain a lot of noise.
Let’s do something challenging.
In this post, we describe the results of applying change point detection method, which is developed by Inforience. This method belongs to the automatic pattern analysis functions included in CoDIP (CoDIP-PA). We will introduce someday the results of applying the method to real data and also explain how to build intelligent services based on this method.
(1) Detecting the moment when the data which kept at the proper level suddenly drops or rises.
If your academic grade is already excellent enough, you may want to keep it, but there may be a moment when it falls. When this happens, you need to know when and why. You may wonder why your favorite celebrity is suddenly mentioned a lot in the news. The room door should not move when there is no family member in your house, so if a movement is detected, it may be an emergency situation. In an environment where humidity must be maintained at an proper level, sudden drops of humidity level can be a problem. It is important to detect these situations as quickly as possible.
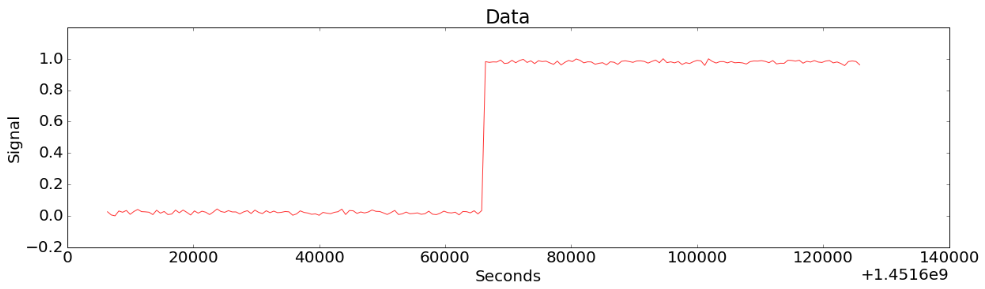
Figure 2-(a)
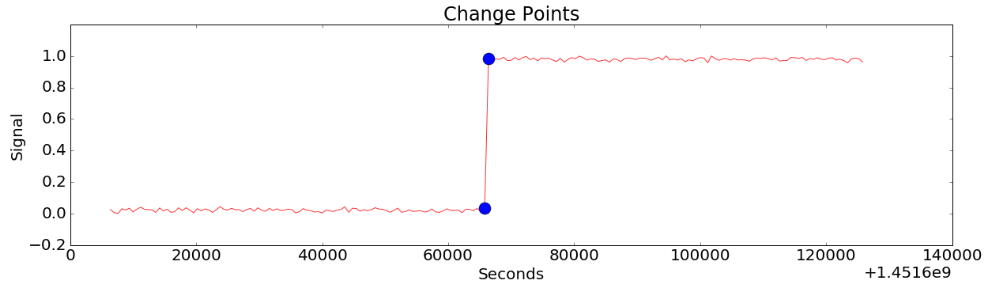
Figure 2-(b)
Figure 2-(a) shows the situation where the value of the data changes abruptly. Figure 2-(b) shows the result of finding the change points by CoDIP-PA. In fact, it does not seem so difficult. You can design a system to detect when the data rises above a certain value. However, it is impossible to specify all of such detection criteria in advance.
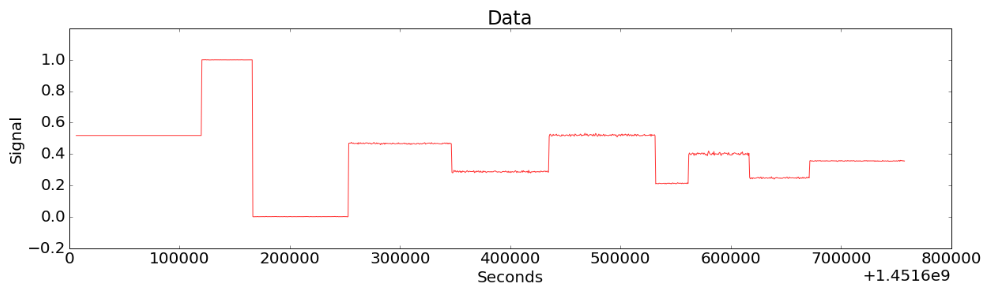
Figure 3-(a)
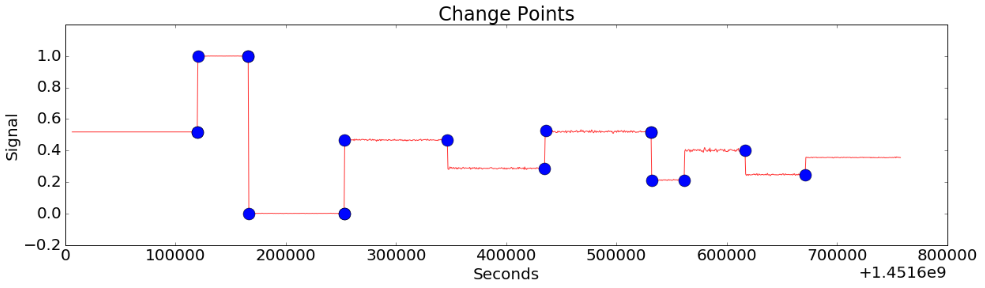
Figure 3-(b)
Figure 3-(a) shows a situation in which sudden rise and fall appear several times in various magnitudes. Figure 3-(b) shows the result of detecting the change points by CoDIP-PA. But in fact, this does not seem too difficult either.
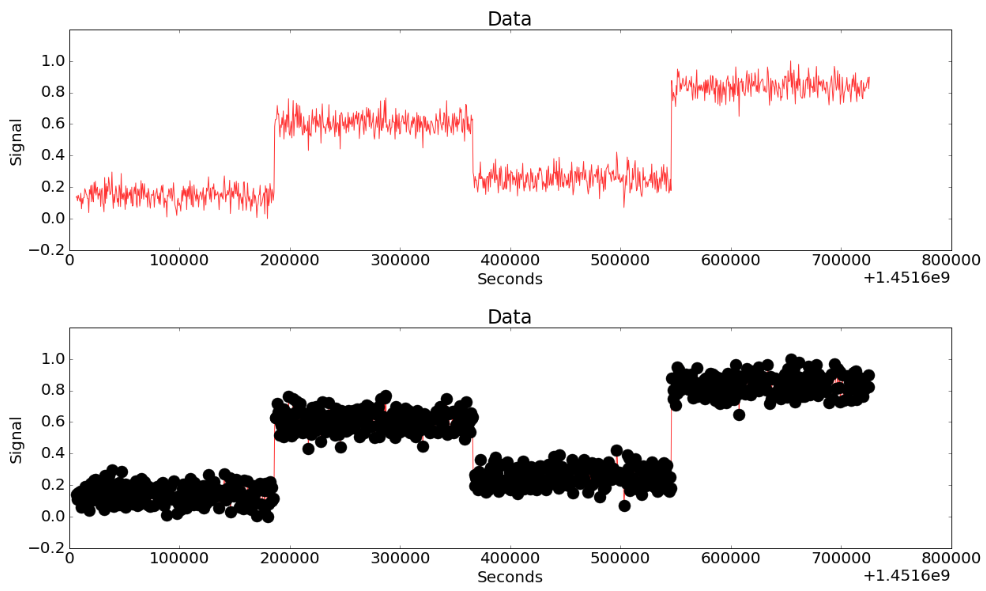
Figure 4-(a)
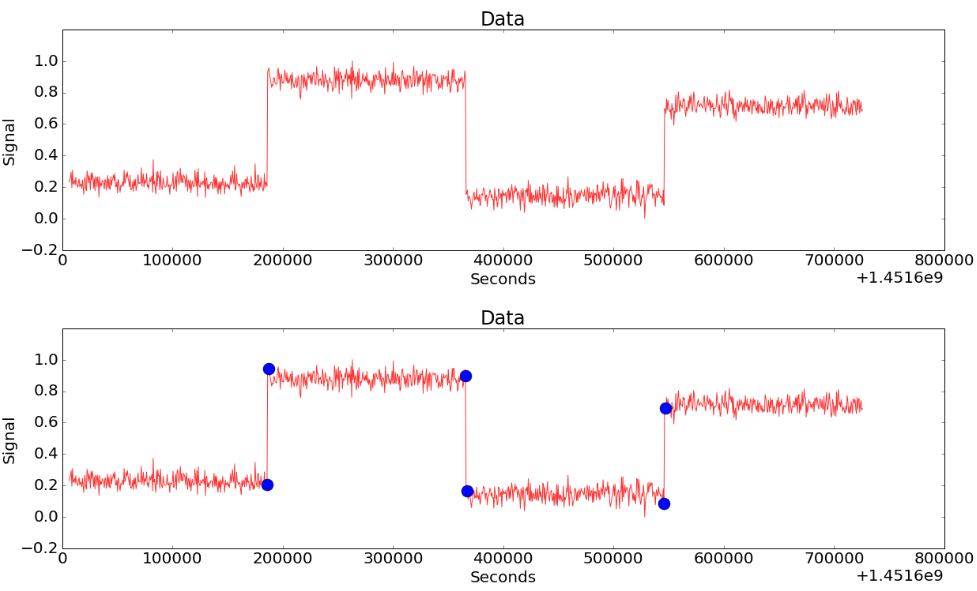
Figure 4-(b)
Figure 4-(a) shows the data including both the noise and the sudden significant changes. Fig. 4-(b) is a result of detecting only large and significant change points while ignoring noise. CoDIP-PA figures out the presence of noise based on the characteristics of early data and identifies significant change points.
(2) Detecting changes of the data that must show a constant movements.
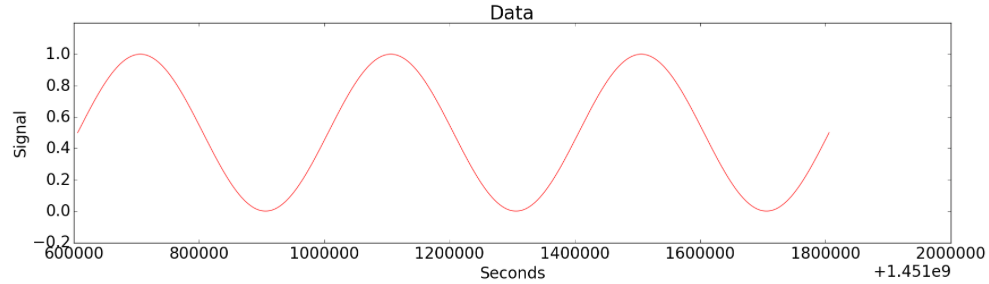
Figure 5-(a)
Figure 5-(a) is the sinusoidal data. When you measure temperature and humidity, temperature is high in daytime, but is low at night or dawn. Humidity shows opposite patterns to temperature change in general. If there is a sudden change that is unfamiliar to us, can we detect it?
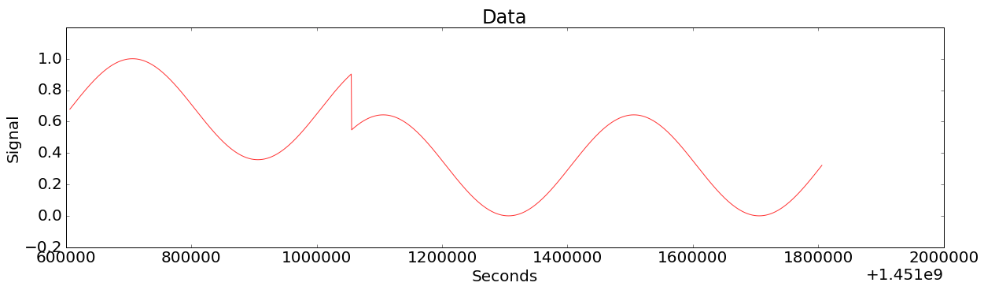
Figure 5-(b)
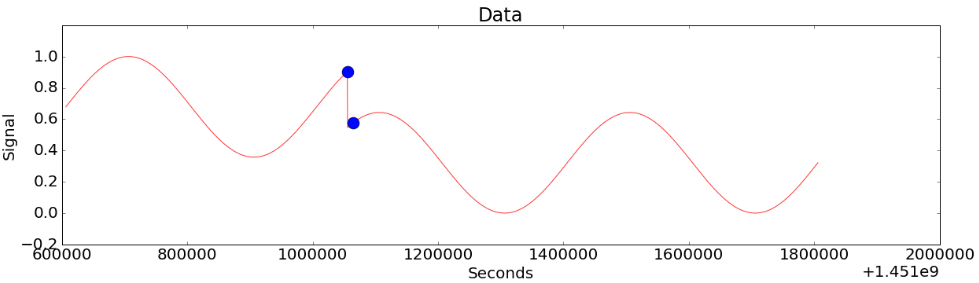
Figure 5-(c)
Figure 5-(b) shows a case where a strange change is included. Figure 5-(c) shows the result of CoDIP-PA detecting the change. After showing the strange change, when the graph returns to its original pattern, it recognizes it as a normal pattern.
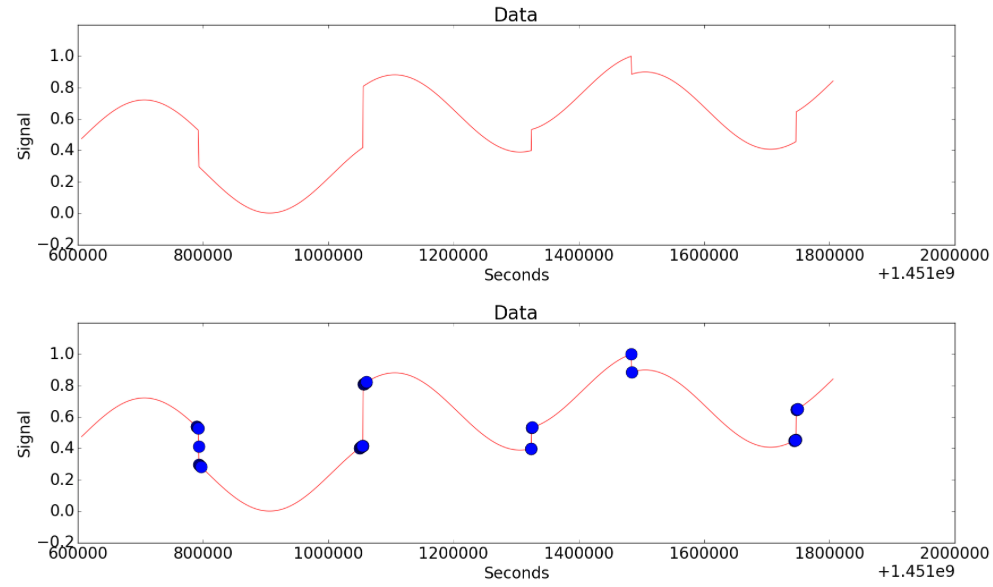
Figure 5-(d)
Figure 5-(d) shows a case where the strange changes appear multiple times. CoDIP-PA detects all the moments in which the strange changes appear.
(3) Detecting the change of frequency (even without change in original data range)
Consider a situation in which an equipment suddenly moves faster. Is it broken? Or the condition of the equipment is worsening?
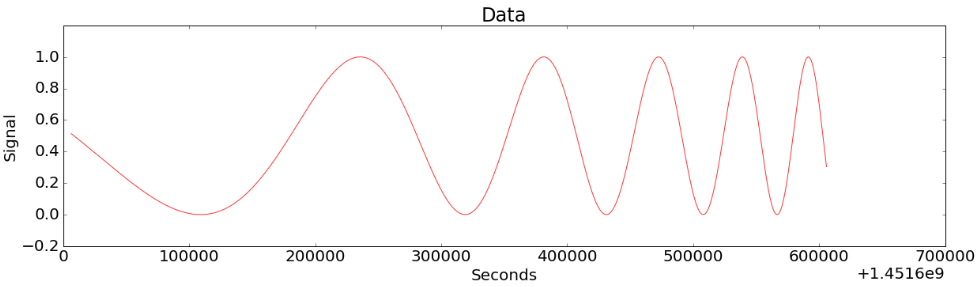
Figure 6-(a)
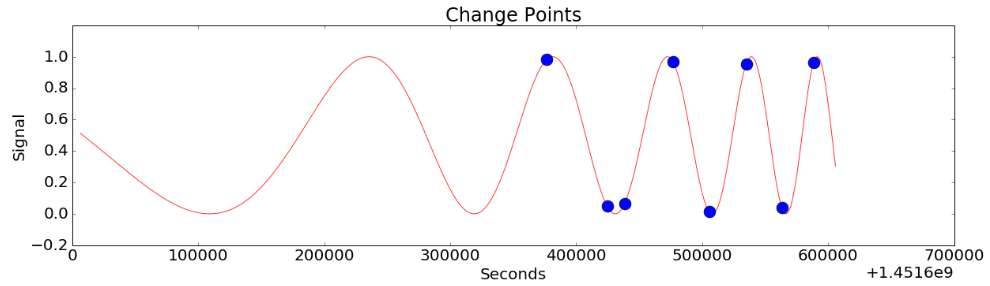
Figure 6-(b)
Figure 6-(a) shows the case where the period of repetitive pattern becomes shorter gradually from a certain moment. (Notice that there is no change in the range of data values.) Figure 6-(b) shows the result of detecting the change by CoDIP-PA.
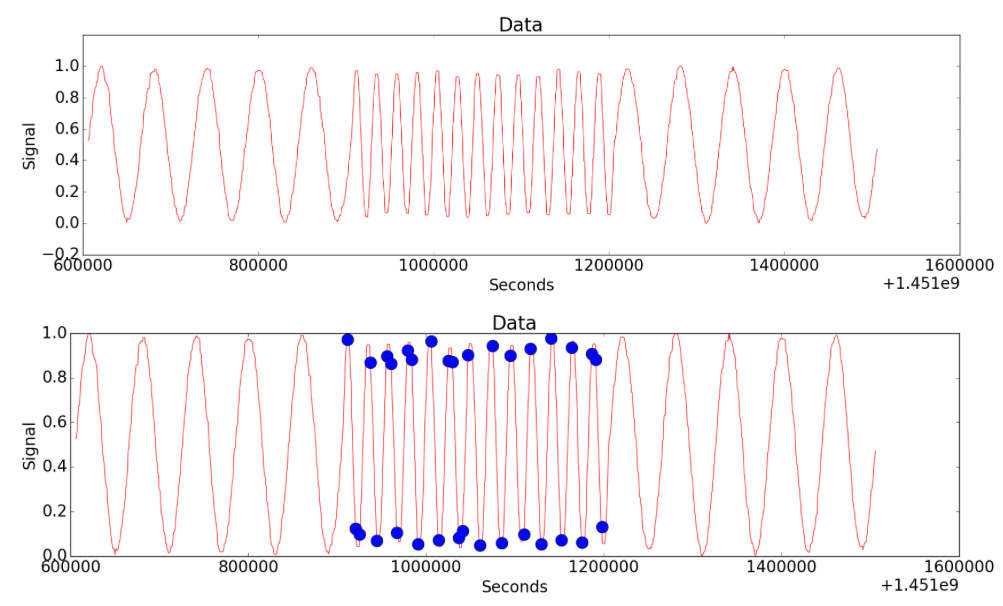
Figure 7
Figure 7 shows a case in which a period change occurs for a little while and then returns to the original periodic pattern. CoDIP-PA precisely detects the timing at which the period change occurs.
(4) Detecting the change of the main fluctuation without falling into noise and small fluctuation.
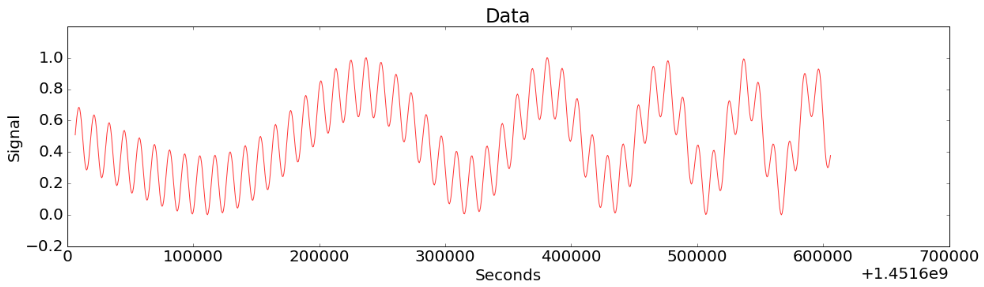
Figure 8-(a)
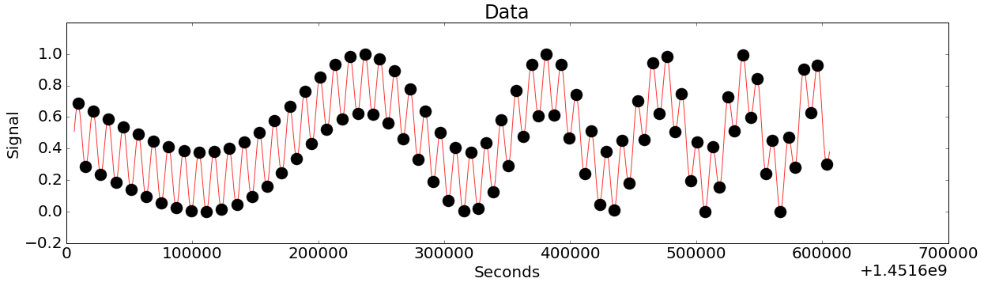
Figure 8-(b)
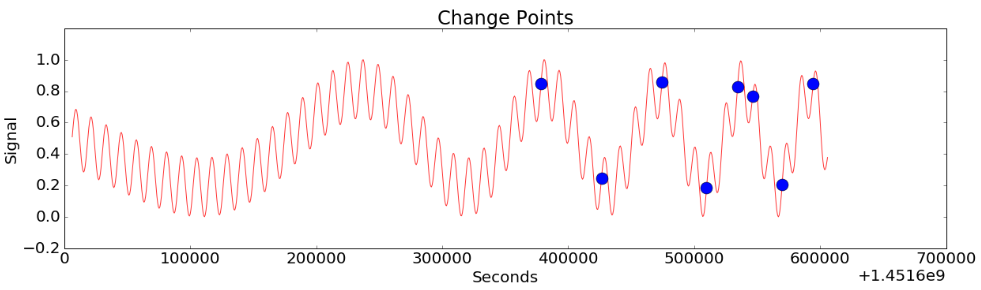
Figure 8-(c)
Figure 8-(a) shows the data with a main fluctuation mixed with the small fluctuation. The period of the main fluctuation is getting smaller. A lack of intelligence will make us fall into small fluctuations without identifying the change of the main fluctuation properly. (Figure 8-(b)). CoDIP-PA figures out the characteristics of the early data and detects only the moment when the period of main fluctuation changes.
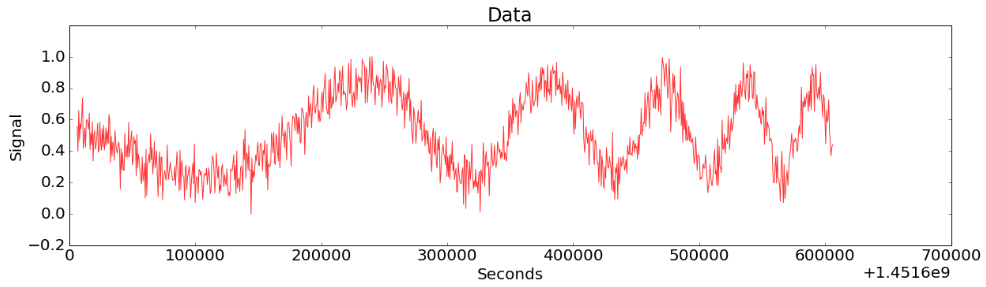
Figure 9-(a)
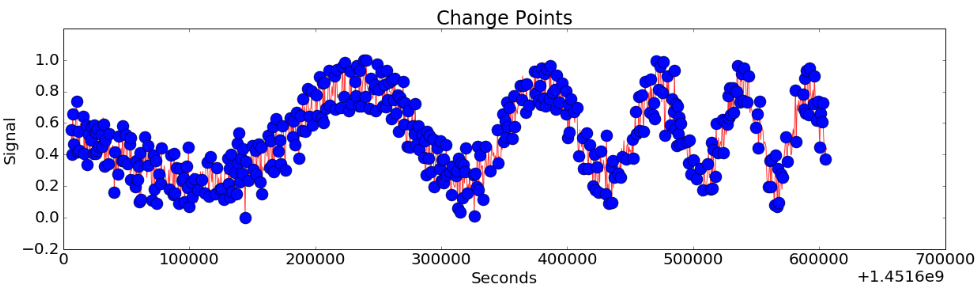
Figure 9-(b)
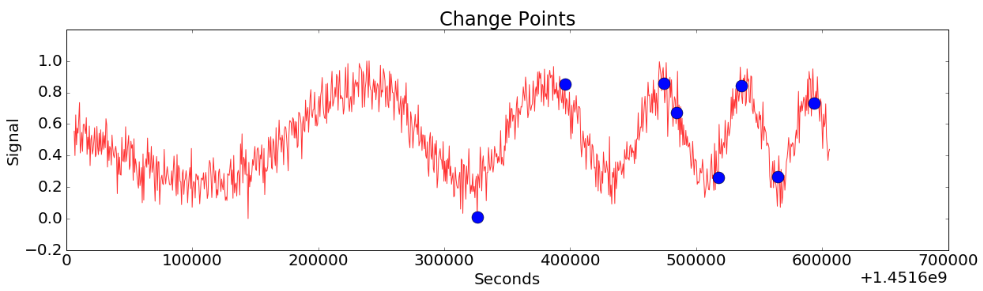
Figure 9-(c)
Figure 9-(a) shows the case where the main fluctuation is mixed with severe noise. In this case, CoDIP-PA also detects the characteristics of the noise and detects only the moment when the period of main fluctuation changes. (Figure 9-(c))
What about the other algorithms?
So far, we showed that CoDIP-PA can adapt itself to the characteristics of the data. Will other algorithms produce the same results for the same data? Let’s look at the result of applying the Bayesian Changepoint Detection [1, 2, 3] and the famous luminol library [4] to the same data.
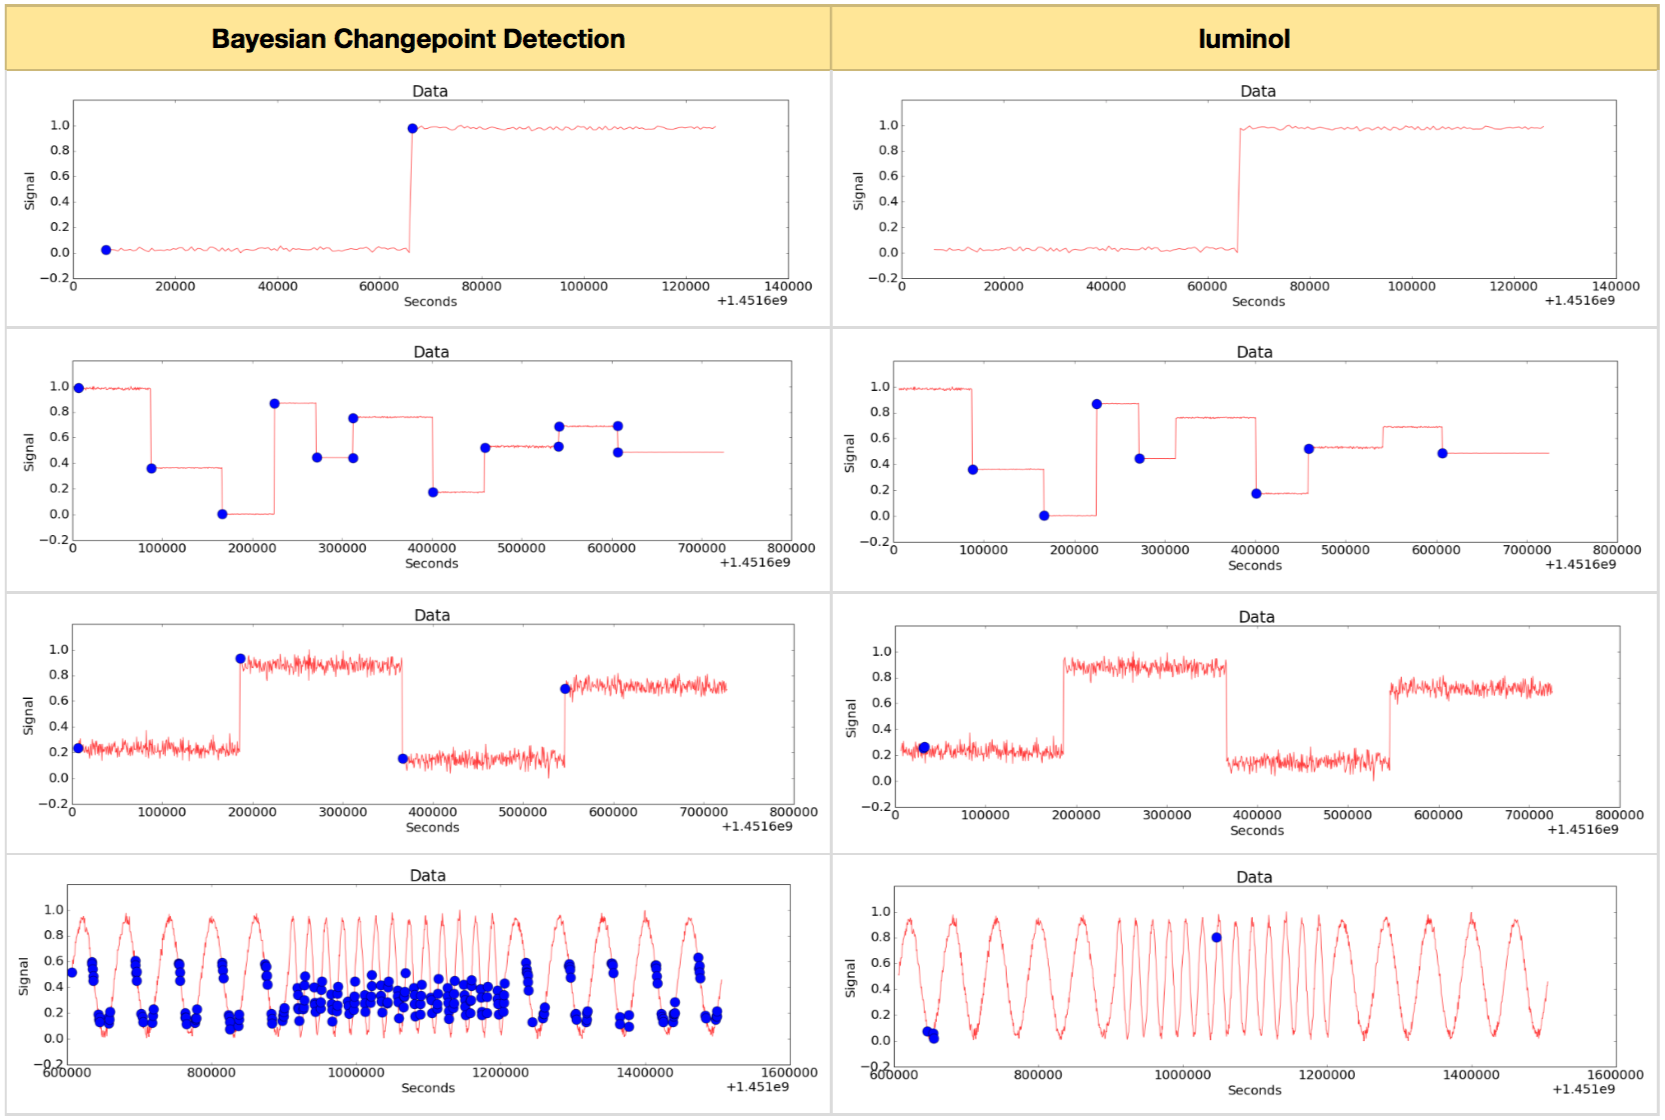
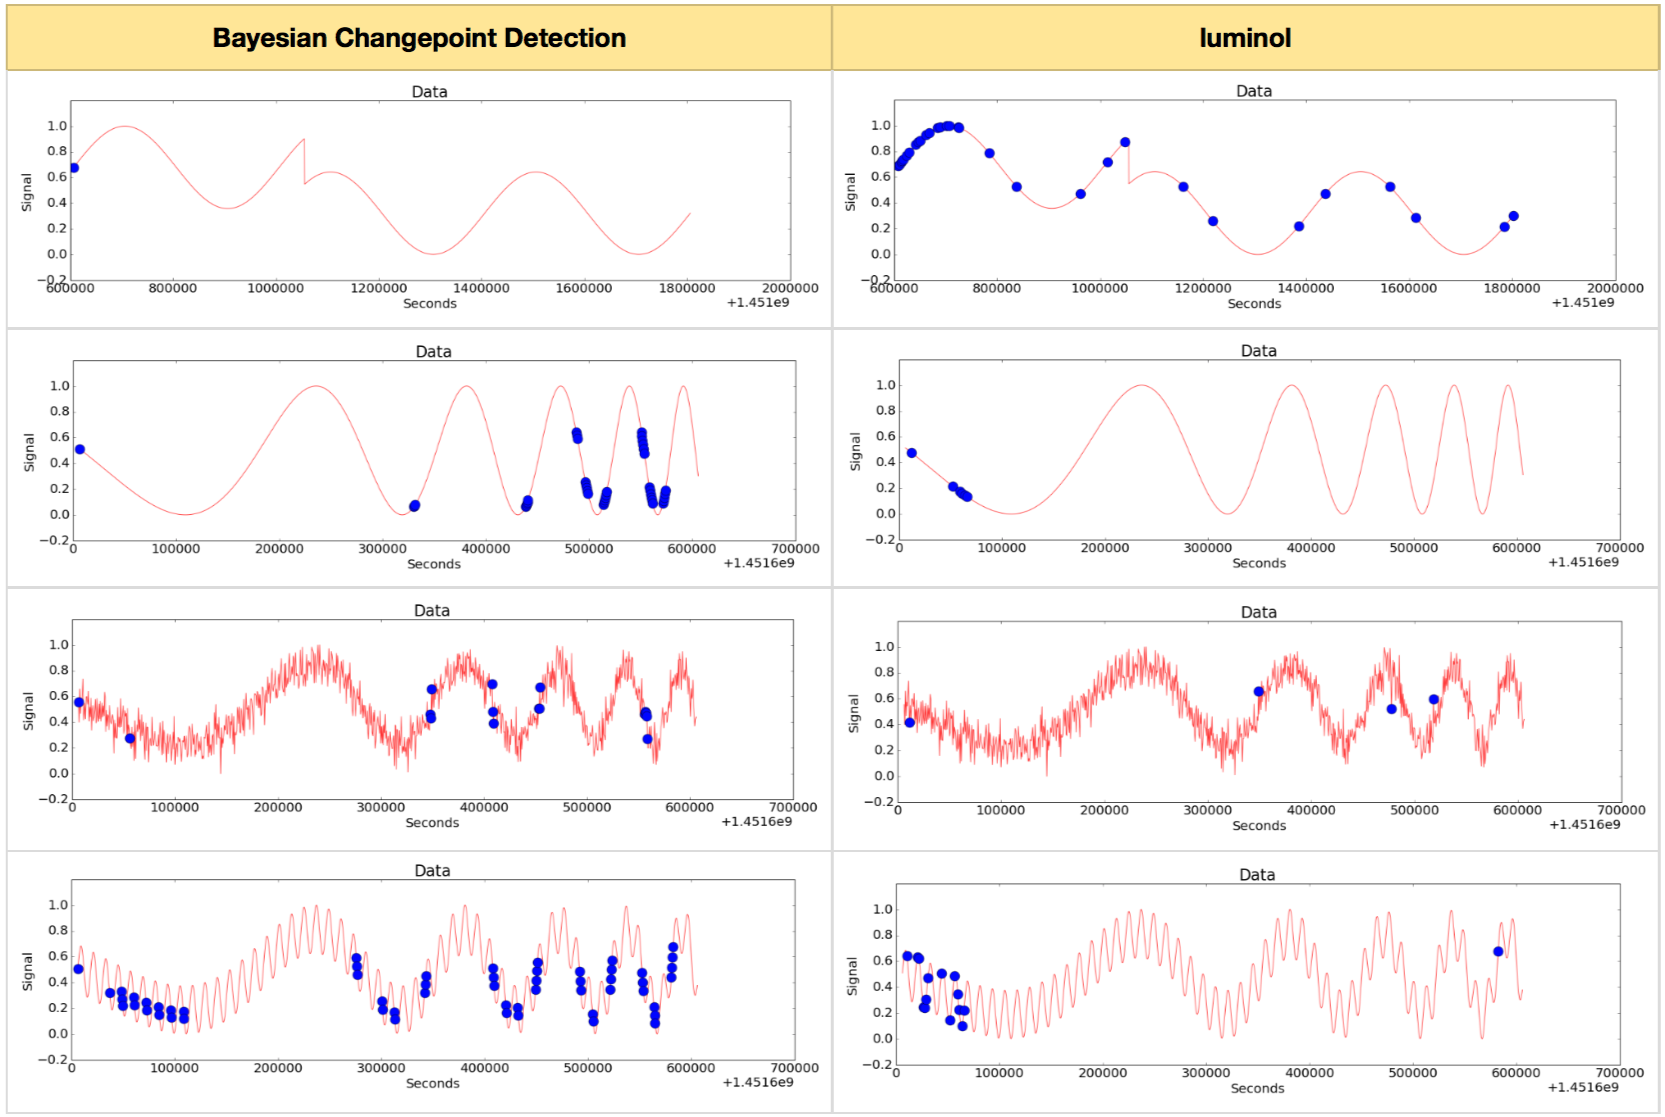
Figure 10. The results of applying Bayesian Changepoint Detection method and luminol library
As you can see in Figure 10, the Bayesian Changepoint Detection method and the luminol library seem to detect simple change points well, but fail to detect complex change points. In particular, they are largely unsuccessful in detecting change points contained in smooth curved patterns. They also often detect non-critical points. This shows how difficult it is to develop a good chage point detection method. This also means that the performance of the change point detection method developed by Inforience is relatively superior.
References
[1] Paul Fearnhead, Exact and Efficient Bayesian Inference for Multiple Changepoint problems, Statistics and computing 16.2 (2006), pp. 203–213
[2] Ryan P. Adams, David J.C. MacKay, Bayesian Online Changepoint Detection, arXiv 0710.3742 (2007)
[3] Xuan Xiang, Kevin Murphy, Modeling Changing Dependency Structure in Multivariate Time Series, ICML (2007), pp. 1055–1062
[4] https://github.com/linkedin/luminol


2개의 댓글
CoDIP을 활용하여 1차원 시계열 데이터에 포함된 change point들을 자동으로 탐지하자.(1) – Inforience · 2018-03-12 8:43 오후
[…] Go to English ver. of this article. (https://inforience.net/2018/03/12/changepoints1d-1/) […]
CoDIP을 활용하여 1차원 시계열 데이터에 포함된 change point들을 자동으로 탐지하자.(1) – 인포리언스 · 2019-06-09 2:32 오후
[…] Go to English ver. of this article. (https://inforience.net/2018/03/12/changepoints1d-1/) […]
댓글이 닫혔습니다.